Yangbo's Blog

MIT 6.828 Lab1 - Booting a PC (The Kernel)

Operating system kernels often like to be linked and run at very high virtual address, such as 0xf0100000, in order to leave the lower part of the processor’s virtual address space for user programs to use. Many machines don’t have any physical memory at address 0xf0100000, so we can’t count on being able to store the kernel there. Instead, we will use the processor’s memory management hardware to map virtual address 0xf0100000 (the link address at which the kernel code expects to run) to physical address 0x00100000 (where the boot loader loaded the kernel into physical memory).

Exercise 7

Pause the program at the kernel entry point:

1
2
3
4
5
6
7
8
9
10
11
12
13
14
15
16
17
(gdb) b *0x10000c
Breakpoint 1 at 0x10000c
(gdb) c
Continuing.
The target architecture is assumed to be i386
=> 0x10000c: movw $0x1234,0x472
Breakpoint 1, 0x0010000c in ?? ()
(gdb) x/8i 0x10000c
=> 0x10000c: movw $0x1234,0x472
0x100015: mov $0x110000,%eax
0x10001a: mov %eax,%cr3
0x10001d: mov %cr0,%eax
0x100020: or $0x80010001,%eax
0x100025: mov %eax,%cr0
0x100028: mov $0xf010002f,%eax
0x10002d: jmp *%eax

Step through a few instructions till it hits the “mov %eax,%cr0”:

1
2
3
4
5
6
7
8
9
10
11
12
13
14
15
16
17
18
19
20
21
22
23
24
25
26
27
28
29
30
31
32
33
34
35
36
37
38
39
40
41
42
(gdb) si
=> 0x100025: mov %eax,%cr0
0x00100025 in ?? ()
(gdb) x/8i 0x100000
0x100000: add 0x1bad(%eax),%dh
0x100006: add %al,(%eax)
0x100008: decb 0x52(%edi)
0x10000b: in $0x66,%al
0x10000d: movl $0xb81234,0x472
0x100017: add %dl,(%ecx)
0x100019: add %cl,(%edi)
0x10001b: and %al,%bl
(gdb) x/8i 0xf0100000
0xf0100000 <_start+4026531828>: add %al,(%eax)
0xf0100002 <_start+4026531830>: add %al,(%eax)
0xf0100004 <_start+4026531832>: add %al,(%eax)
0xf0100006 <_start+4026531834>: add %al,(%eax)
0xf0100008 <_start+4026531836>: add %al,(%eax)
0xf010000a <_start+4026531838>: add %al,(%eax)
0xf010000c <entry>: add %al,(%eax)
0xf010000e <entry+2>: add %al,(%eax)
(gdb) si
=> 0x100028: mov $0xf010002f,%eax
0x00100028 in ?? ()
(gdb) x/8i 0x100000
0x100000: add 0x1bad(%eax),%dh
0x100006: add %al,(%eax)
0x100008: decb 0x52(%edi)
0x10000b: in $0x66,%al
0x10000d: movl $0xb81234,0x472
0x100017: add %dl,(%ecx)
0x100019: add %cl,(%edi)
0x10001b: and %al,%bl
(gdb) x/8i 0xf0100000
0xf0100000 <_start+4026531828>: add 0x1bad(%eax),%dh
0xf0100006 <_start+4026531834>: add %al,(%eax)
0xf0100008 <_start+4026531836>: decb 0x52(%edi)
0xf010000b <_start+4026531839>: in $0x66,%al
0xf010000d <entry+1>: movl $0xb81234,0x472
0xf0100017 <entry+11>: add %dl,(%ecx)
0xf0100019 <entry+13>: add %cl,(%edi)
0xf010001b <entry+15>: and %al,%bl

Apparently the memory content at 0x100000 was mapped to address 0xf0100000 after the instruction. The first instruction that would fail if the mapping wasn’t correct should be “mov $0x0,%ebp” at address 0xf010002f, which is the first instruction that should be executed in the mapped memory. As can be seen below, after deleting the instruction, the kernel code will jump to 0xf010002c instead of 0xf010002f. After it jumps there the kernel crashes and prints error message, “qemu: fatal: Trying to execute code outside RAM or ROM at 0xf010002c”.

Before deleting the instruction:

1
2
3
4
5
6
7
8
9
(gdb) x/8i 0x10000c
=> 0x10000c: movw $0x1234,0x472
0x100015: mov $0x110000,%eax
0x10001a: mov %eax,%cr3
0x10001d: mov %cr0,%eax
0x100020: or $0x80010001,%eax
0x100025: mov %eax,%cr0
0x100028: mov $0xf010002f,%eax
0x10002d: jmp *%eax

After deleting the instruction:

1
2
3
4
5
6
7
8
9
(gdb) x/8i 0x10000c
=> 0x10000c: movw $0x1234,0x472
0x100015: mov $0x110000,%eax
0x10001a: mov %eax,%cr3
0x10001d: mov %cr0,%eax
0x100020: or $0x80010001,%eax
0x100025: mov $0xf010002c,%eax
0x10002a: jmp *%eax
0x10002c: mov $0x0,%ebp

Exercise 8

Fill in the missing code segment to print octal numbers using patterns of the form “%o”:

1
2
3
4
5
// (unsigned) octal
case 'o':
num = getuint(&ap, lflag);
base = 8;
goto number;

The implementation of cprintf (in printf.c) console output for the kernel is based on the kernel console’s cputchar() function (in console.c), which output a character to the console.

The purpose of the following code chunk is explained by the comments:

1
2
3
4
5
6
7
8
9
/* when the vga display is full screen, move the display upward by one row */
if (crt_pos >= CRT_SIZE) {
int i;
/* move the current display upward by one row */
memmove(crt_buf, crt_buf + CRT_COLS, (CRT_SIZE - CRT_COLS) * sizeof(uint16_t));
for (i = CRT_SIZE - CRT_COLS; i < CRT_SIZE; i++)
crt_buf[i] = 0x0700 | ' '; /* initiaize the new row at the bottom to be blank */
crt_pos -= CRT_COLS; /* cursor points to the beginning of the new bottom row */
}

For the below code snippet, in the call to cprintf(), fmt points to the string literal “x %d, y %x, z %d\n”; ap points to the second argument which is x.

1
2
int x = 1, y = 3, z = 4;
cprintf("x %d, y %x, z %d\n", x, y, z);

Exercise 9

The two lines in entry.S below initialize the kernel’s stack:

1
2
movl $0x0,%ebp # nuke frame pointer
movl $(bootstacktop),%esp

According to the disassembled file kernel.asm, the stack locates at 0xf0110000. The stack space is given by .space KSTKSIZE in entry.S.

1
2
3
# Set the stack pointer
movl $(bootstacktop),%esp
f0100034: bc 00 00 11 f0 mov $0xf0110000,%esp

Exercise 10

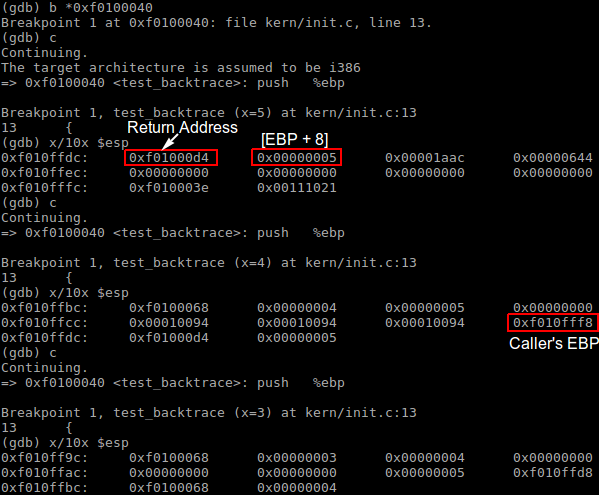
To understand how a stack frame is set up and taken down when a C function call is made, refer to C Function Call Conventions and the Stack. Each recursive nesting level of test_backtrace pushes 8 32-bit words on the stack. The are the function’s return address, arguments, stack base pointer EBP, etc., as illustrated below.

Exercise 11

The backtrack function mon_backtrace in kern/monitor.c is implmented as below:

1
2
3
4
5
6
7
8
9
10
11
12
13
14
15
16
17
int
mon_backtrace(int argc, char **argv, struct Trapframe *tf)
{
uint32_t ebp = read_ebp();
cprintf("Stack backtraces:\n");
/* ebp's initial value is set to 0 in kern/entry.S */
while (ebp != 0) {
/* eip and arguments' addresses can be inferred from ebp */
cprintf(" ebp %08x eip %08x args %08x %08x %08x %08x %08x\n",
ebp, *(uint32_t *)(ebp + 4), *(uint32_t *)(ebp + 8), *(uint32_t *)(ebp + 12),
*(uint32_t *)(ebp + 16), *(uint32_t *)(ebp + 20), *(uint32_t *)(ebp + 24));
/* obtain caller's ebp */
ebp = *(uint32_t *)ebp;
}
return 0;
}

Exercise 11

The implementation of debuginfo_eip is completed by inserting the call to stab_binsearch to find the line number for an address:

1
2
3
4
5
6
7
stab_binsearch(stabs, &lline, &rline, N_SLINE, addr);
if (lline <= rline) {
info->eip_line = stabs[lline].n_desc;
} else {
// Couldn't find a line number.
return -1;
}

The implementation of mon_backtrace is extended by calling debuginfo_eip to print a line for each stack frame:

1
2
3
4
5
6
7
8
9
10
11
12
13
14
15
16
17
18
19
20
21
22
23
24
25
26
int
mon_backtrace(int argc, char **argv, struct Trapframe *tf)
{
uint32_t ebp = read_ebp();
struct Eipdebuginfo info;
cprintf("Stack backtraces:\n");
/* ebp's initial value is set to 0 in kern/entry.S */
while (ebp != 0) {
/* eip and arguments' addresses can be inferred from ebp */
cprintf(" ebp %08x eip %08x args %08x %08x %08x %08x %08x\n",
ebp, *(uint32_t *)(ebp + 4), *(uint32_t *)(ebp + 8), *(uint32_t *)(ebp + 12),
*(uint32_t *)(ebp + 16), *(uint32_t *)(ebp + 20), *(uint32_t *)(ebp + 24));
/* look up eip in the symbol table and obtain more debugging info */
if (debuginfo_eip(*(uint32_t *)(ebp + 4), &info) == 0) {
cprintf(" %s:%d: %.*s+%d\n",
info.eip_file, info.eip_line, info.eip_fn_namelen, info.eip_fn_name,
*(uint32_t *)(ebp + 4) - info.eip_fn_addr);
}
/* obtain caller's ebp */
ebp = *(uint32_t *)ebp;
}
return 0;
}